Image

Description
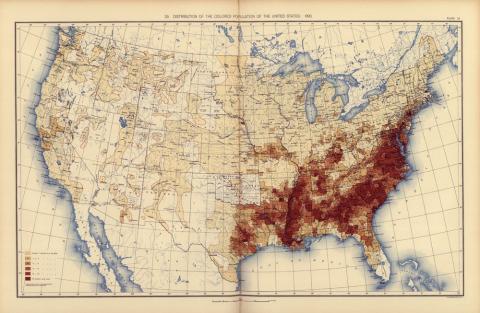
A statistical atlas of the United States that is based on the results of the 11th census, completed in 1890, shows the distribution of the "colored population" of the country. As can be seen in the distribution map, members of the targeted population predominantly resided in the southeast.
Source-Dependent Questions
- Infer as to why the densest population of African Americans was along major rivers in the South?
- Compare this map to the “Distribution of Negro Population by County 1950” map. What are the similarities and differences?
Citation Information
United States Census Office, 11th Census (1890), and Henry Gannett, Statistical Atlas of the United States, based upon the results of the eleventh census, Washington, 1898. Courtesy of Library of Congress