Image

Description
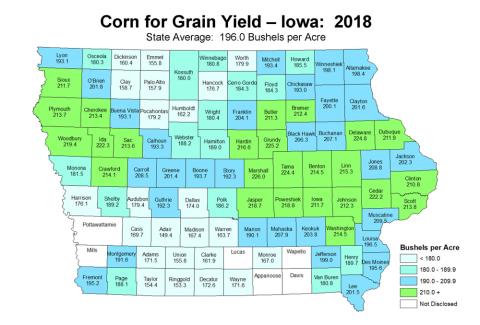
Each year, the United States Department of Agriculture puts out statistics about what happened in agriculture that year. This map shows the average bushels of corn produced per acre for by county. Many variables impact the corn crop yield such as weather and soil conditions. The top of the map reads that the state average is 196.0 bushels per acre.
Transcript of "Corn for Grain Yield - Iowa: 2018" Map
Source-Dependent Questions
- What was the statewide average corn yield from 2018?
- How does this statewide average corn yield compare with the statewide average yield in 1928 to 1932? Make a graph to show the comparison.
- 2018 was a drought year for some parts of Iowa. Use evidence from the map to predict which parts of Iowa received less rain and hotter temperatures.
Citation Information
"Corn for Grain Yield – Iowa: 2018," National Agricultural Statistics Service, United States Department of Agriculture (USDA), 2018. Courtesy of USDA