Description
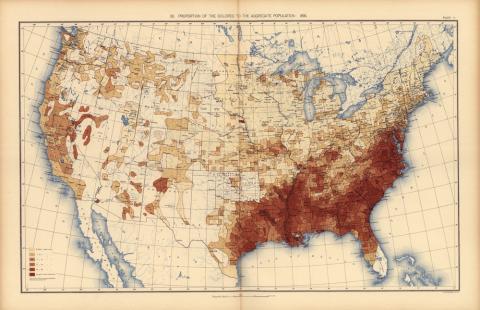
Based upon the results of the 11th census, this map from the 1898 Statistical Atlas of the United States depicts the percentage of people of color per square mile across the United States. Although the heaviest concentrations are overwhelmingly in Maryland, Virginia and the southeastern states, there appear to be emerging concentrations in the northern urban areas (New York City, Philadelphia, Pittsburgh, Cleveland, Toledo and Chicago), southern Ohio, central Missouri, eastern Kansas and scattered areas in the West (Oklahoma, New Mexico, Arizona, Nevada and California), reflecting migration patterns that began during Reconstruction.
Transcript of "Proportion of the Colored to the Aggregate Population: 1890"
Source-Dependent Questions
- What region of the United States was most heavily populated by African Americans? Beyond this region, where else had this specific population migrated since the end of the Civil War? (ignore areas marked as Indian Reservations)
- What do you notice about large urban areas and the distribution of people of color across the country?
- What might have motivated African Americans to migrate out of the South during Reconstruction? What factors might have forced and/or encouraged them to do so?
- Using the key and making reference to specific locations, describe Iowa’s population of people of color. Compare Iowa’s cities to others across the United States with similar populations of people of color.
- What is the connection between the ratification of the 13th Amendment and the data presented in this map?
Citation Information
"Proportion of the Colored to the aggregate population: 1890," Statistical Atlas of the United States, 1898. Courtesy of Library of Congress