Image

Description
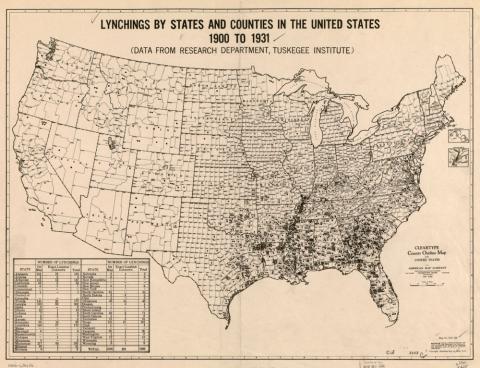
This 1931 map, based on data collected by the Tuskegee Institute, depicted lynchings per county throughout the entire United States between 1900 and 1931. In the bottom left-hand corner of the map, a table can be found that compares lynchings by state.
Transcript of "Lynchings by States and Counties in the United States" Map
Source-Dependent Questions
- Where were lynchings most common? Where were they least common? What other trends do you notice?
- Is it fair to suggest lynching was a national problem at the time? Explain using data from the map.
- How many lynchings occurred in Iowa between 1900-1931? Where did they occur? How does the number of lynchings in Iowa compare to other upper midwestern states?
- Given that this map was created in 1931, forty-four years after the Compromise of 1877, how can the data presented in it help you determine whether or not Reconstruction was a success?
Citation Information
"Lynchings by states and counties in the United States, 1900-1931 : (data from Research Department, Tuskegee Institute) ; cleartype county outline map of the United States," ca. 1931. Courtesy of Library of Congress