Image

Description
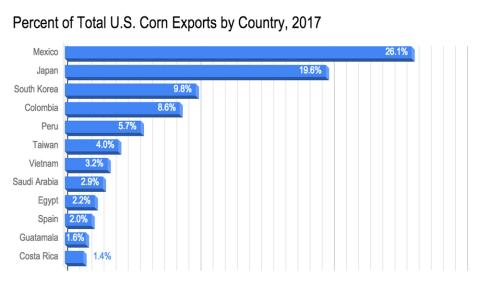
The Foreign Agricultural Service department of the USDA published a chart showing the countries who received corn that was exported from the United States during the marketing year 2017 through 2018. This means the corn was grown during the summer of 2017, harvested in the fall of 2017, and sold in late 2017 or in the winter/spring of 2018.
Transcript of "Percent of Total U.S. Corn Exports by Country" Graph
Source-Dependent Questions
- According to this graph, which continent(s) receive the most grain from the United States?
- For how many of the countries that the United States exports to will the corn travel on a ship or ocean liner?
Citation Information
"Percent of Total U.S. Corn Exports by Country, 2017," Foreign Agricultural Service, United States Department of Agriculture (USDA), 2017. Courtesy of USDA