Image

Description
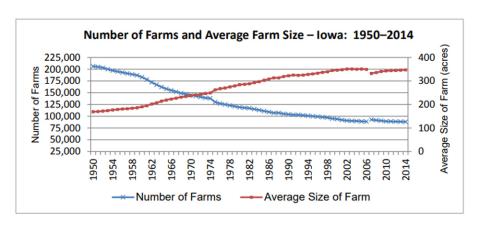
This graph looks at the number of farms compared to the average farm size in Iowa from 1950 to 2014.
Transcript of "Number of Farms and Average Farm Size - Iowa: 1950-2014"
Source-Dependent Questions
- When the same measurement is taken over a period of time and put on a graph, a trend line forms. What is the trend for the number of farms in Iowa from 1950 to 2014? What is the trend for the average size of a farm in Iowa from 1950 to 2014?
- Connect to what you know about urban and rural areas as well as agriculture and manufacturing. Make a prediction about where people are living and what kinds of jobs they may have today versus long ago. Explain your prediction.
Citation Information
"Number of Farms and Average Farm Size - Iowa: 1950-2014," pp. 10, Iowa Agricultural Statistics Bulletin, National Agricultural Statistics Service, United States Department of Agriculture (USDA), 2015. Courtesy of USDA