Image

Description
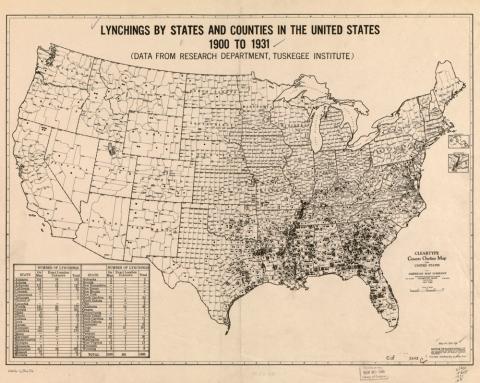
This was a map depicting the number of lynchings by state and county in the United States from 1900 to 1931. The map shows the heaviest concentration of lynchings occurring in southern states.
Transcript of the "Lynchings by States and Counties in the United States" Map
Source-Dependent Questions
- Look at the transcribed key and the map, what did each dot on the map represent? Which states had the most number of lynchings? Where were those states located?
- How does this map support the need for the Antilynching Bill?
- Would this map inspire hope, fear or both? Cite evidence to support your claim.
Citation Information
"Lynchings by States and Counties in the United States, 1900-1931," ca. 1931. Courtesy of Library of Congress